How to Leverage House Flipping to Fund Early Retirement
Charlotte MeierHow to Leverage House Flipping to Fund Early Retirement Perhaps you hope to retire early, but you’re not sure if this will be possible

Rate Rank | State Name | Total Properties with Filings | %Housing Units |
U.S. | 185,580 | 0.13 | |
25 | Alabama | 2,239 | 0.10 |
24 | Alaska | 312 | 0.10 |
22 | Arizona | 3,078 | 0.10 |
23 | Arkansas | 1,369 | 0.10 |
16 | California | 17,914 | 0.13 |
30 | Colorado | 2,179 | 0.09 |
10 | Connecticut | 2,437 | 0.16 |
4 | Delaware | 1,004 | 0.23 |
District of Columbia | 496 | 0.14 | |
7 | Florida | 18,530 | 0.19 |
13 | Georgia | 6,308 | 0.14 |
28 | Hawaii | 517 | 0.09 |
42 | Idaho | 460 | 0.06 |
1 | Illinois | 13,619 | 0.25 |
9 | Indiana | 5,254 | 0.18 |
14 | Iowa | 1,860 | 0.13 |
46 | Kansas | 603 | 0.05 |
45 | Kentucky | 953 | 0.05 |
21 | Louisiana | 2,197 | 0.11 |
37 | Maine | 555 | 0.08 |
3 | Maryland | 5,858 | 0.23 |
34 | Massachusetts | 2,342 | 0.08 |
11 | Michigan | 7,088 | 0.16 |
27 | Minnesota | 2,329 | 0.09 |
33 | Mississippi | 1,051 | 0.08 |
35 | Missouri | 2,138 | 0.08 |
47 | Montana | 203 | 0.04 |
36 | Nebraska | 643 | 0.08 |
8 | Nevada | 2,402 | 0.19 |
40 | New Hampshire | 452 | 0.07 |
2 | New Jersey | 9,094 | 0.24 |
20 | New Mexico | 1,113 | 0.12 |
12 | New York | 12,193 | 0.14 |
18 | North Carolina | 5,725 | 0.12 |
48 | North Dakota | 103 | 0.03 |
5 | Ohio | 10,546 | 0.20 |
15 | Oklahoma | 2,273 | 0.13 |
39 | Oregon | 1,298 | 0.07 |
17 | Pennsylvania | 7,076 | 0.12 |
38 | Rhode Island | 361 | 0.08 |
6 | South Carolina | 4,511 | 0.19 |
50 | South Dakota | 44 | 0.01 |
32 | Tennessee | 2,521 | 0.08 |
19 | Texas | 13,869 | 0.12 |
29 | Utah | 1,045 | 0.09 |
49 | Vermont | 71 | 0.02 |
26 | Virginia | 3,391 | 0.09 |
44 | Washington | 1,551 | 0.05 |
43 | West Virginia | 431 | 0.05 |
41 | Wisconsin | 1,735 | 0.06 |
31 | Wyoming | 239 | 0.09 |
By ATTOM Data | Jun 22, 2023
Foreclosure starts up 15 percent from last year
A total of 135,065 U.S. properties started the foreclosure process in the first six months of 2023, up 15 percent from the first half of last year and up 36 percent from the first half of 2020.
States that saw the greatest number of foreclosures starts in the first half of 2023 included California (14,217 foreclosure starts); Florida (13,837 foreclosure starts); Texas (13,419 foreclosure starts); New York (8,772 foreclosure starts); and Illinois (7,995 foreclosure starts).
Bank repossessions climb in first half of 2023 from last year
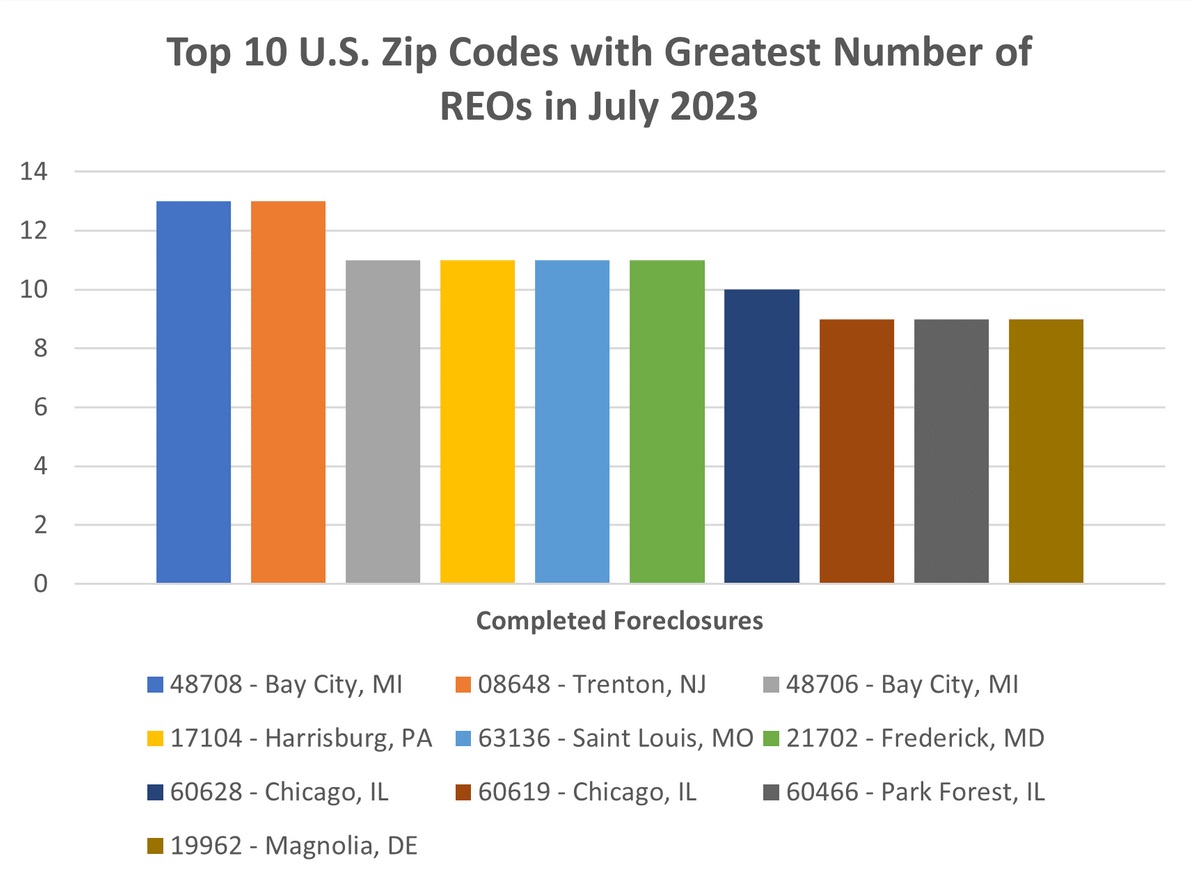
Lenders foreclosed (REO) on a total of 22,672 U.S. properties in the first six months of 2023, up 9 percent from the first half of 2022 and up 133 percent from the first half of 2021, but down 40 percent from the first half of 2020.
States that posted the greatest number of REOs in the first half of 2023 included Michigan (2,423 REOs); Illinois (2,059 REOs); Pennsylvania (1,420 REOs); California (1,362 REOs); and New York (1,350 REOs).
Q2 2023 foreclosure activity below pre-recession averages in 78 percent of major markets
There were a total of 97,608 U.S. properties with a foreclosure filings during the second quarter of 2023, up 2 percent from the previous quarter and up 8 percent from a year ago.
The national foreclosure activity total in Q2 2023 was 65 percent below the pre-recession average of 278,912 per quarter from Q1 2006 to Q3 2007.
Second quarter foreclosure activity was below pre-recession averages in 173 out 223 (78 percent) metropolitan statistical areas with a population of at least 200,000 and sufficient historical foreclosure data, including New York, Los Angeles, Chicago, Dallas, Houston, Miami, Atlanta, San Francisco, Riverside-San Bernardino, Phoenix, and Detroit.
Metro areas with second quarter foreclosure activity above pre-recession averages included Honolulu, HI; Richmond, VA; Baltimore, MD; Virginia-Beach, VA; Albany, New York; and Montgomery, AL.
Average time to foreclose hits all-time high
Properties foreclosed in Q2 2023 had been in the foreclosure process an average of 1,212 days, the highest number of average days to foreclose since Q1 2018. That figure was up 28 percent from the previous quarter and up 28 percent from Q2 2022.

By ATTOM Data | Jun 22, 2023


By ATTOM Data | Jun 22, 2 2023
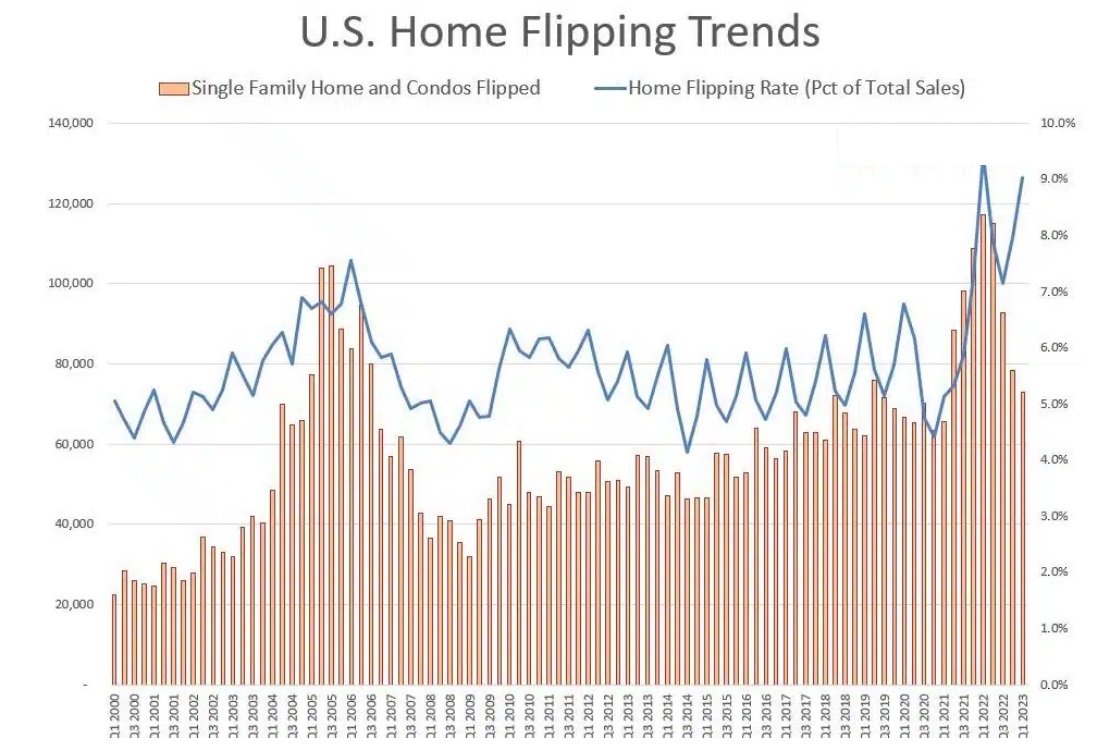
Home flips as a portion of all home sales increased from the fourth quarter of 2022 to the first quarter of 2023 in 128 of the 172 metropolitan statistical areas around the U.S. with enough data to analyze (74 percent). The increases were mostly by less than two percentage points. (Metro areas were included if they had a population of 200,000 or more and at least 50 home flips in the first quarter of 2023).
Among those metros, the largest flipping rates during the first quarter of 2023 were in Macon, GA (flips comprised 16.8 percent of all home sales); Atlanta, GA (15.3 percent); Jacksonville, FL (15.2 percent); Memphis, TN (14.4 percent) and Clarksville, TN (14.3 percent).
Aside from Atlanta, Jacksonville and Memphis, the largest flipping rates among metro areas with a population of more than 1 million were in Phoenix, AZ (13.9 percent) and Charlotte, NC (13.2 percent).
The smallest home-flipping rates among metro areas analyzed in the first quarter were in Indianapolis, IN (4 percent); Wichita, KS (5 percent); Bridgeport, CT (5 percent); Madison, WI (5.2 percent) and South Bend, IN (5.3 percent).

Charlotte MeierHow to Leverage House Flipping to Fund Early Retirement Perhaps you hope to retire early, but you’re not sure if this will be possible

Charlotte MeierFor adults planning a return to college, house flipping can be a creative and realistic way to fund their education. From choosing the right
Samuel LeedsHow AI Will Transform the Real Estate Market Artificial intelligence is coming, and it will change the property industry forever. By Samuel Leeds •

Matthew BenningIt can be hard to imagine that you could flip a home and make a profit without investing a dime of your own money.

Tom Christo What is a property investment loan? An investment property protects the security for the investment loan. The lender will fund the purchase of

Tom Christo How can you get a loan to flip a house? The answer to this question is definitely yes, as a real estate investor
Compare listings
ComparePlease enter your username or email address. You will receive a link to create a new password via email.
